Lithium-Ion Battery Market Share, Size, Statistics, Growth Opportunities & Industry Forecast Report, 2025-2032
1. Executive Summary
1.1. Key Market Insights
2. Introduction
2.1. Study Objectives
2.2. Market Definition
2.2.1. Market Covered
2.2.2. Regional Coverage
2.2.3. Study Years & Currency
2.3. Market Stakeholders
2.4. Key Questions this Study will Answer
2.5. GMI Research’s Approach & Methodology
2.5.1. Research Data
2.5.2. Primary Data
2.5.3. Demand Side and Supply Side Analysis
2.5.4. Market Size Estimation
2.5.5. Research Assumptions
3. Global Lithium-Ion Battery Market- Overview
3.1. Introduction
3.2. Market Segmentation
3.3. Value Chain Analysis
3.4. Market Drivers
3.5. Market Restraints
3.6. Market Trends
4. Global Lithium-Ion Battery Market Revenue Forecast till 2032
5. Global Lithium-Ion Battery Market by Product Revenue Forecast till 2032
5.1. Lithium Cobalt Oxide (LCO)
5.2. Lithium Iron Phosphate (LFP)
5.3. Lithium Nickel Cobalt Aluminum Oxide
5.4. Lithium Manganese Oxide
5.5. Lithium Titanate
5.6. Lithium Nickel Manganese Cobalt
6. Global Lithium-Ion Battery Market by Capacity Revenue Forecast till 2032
6.1. Below 3,000 mAh
6.2. 3,001 mAh–10,000 mAh
6.3. 10,001 mAh–60,000 mAh
6.4. Above 60,000 mAh)
7. Global Lithium-Ion Battery Market by Application Revenue Forecast till 2032
7.1. Automotive
7.2. Consumer Electronics
7.3. Industrial
7.4. Energy Storage Systems
7.5. Medical Devices
7.6. Others
8. Global Lithium-Ion Battery Market by Region Revenue Forecast till 2032
8.1. North America Lithium-Ion Battery Market Revenue Forecast till 2032
(Option 1: As a part of the free 25% customization)
8.1.1. North America Lithium-Ion Battery Market by Product
8.1.1.1. Lithium Cobalt Oxide (LCO)
8.1.1.2. Lithium Iron Phosphate (LFP)
8.1.1.3. Lithium Nickel Cobalt Aluminum Oxide
8.1.1.4. Lithium Manganese Oxide
8.1.1.5. Lithium Titanate
8.1.1.6. Lithium Nickel Manganese Cobalt
8.1.2. North America Lithium-Ion Battery Market by Capacity
8.1.2.1. Below 3,000 mAh
8.1.2.2. 3,001 mAh–10,000 mAh
8.1.2.3. 10,001 mAh–60,000 mAh
8.1.2.4. Above 60,000 mAh)
8.1.3. North America Lithium-Ion Battery Market by Application
8.1.3.1. Automotive
8.1.3.2. Consumer Electronics
8.1.3.3. Industrial
8.1.3.4. Energy Storage Systems
8.1.3.5. Medical Devices
8.1.3.6. Others
8.1.4. US Lithium-Ion Battery Market All-Up
8.1.5. Canada Lithium-Ion Battery Market All-Up
8.2. Europe Lithium-Ion Battery Market Revenue Forecast till 2032
(Option 2: As a part of the free 25% customization)
8.2.1. Europe Lithium-Ion Battery Market by Product
8.2.1.1. Lithium Cobalt Oxide (LCO)
8.2.1.2. Lithium Iron Phosphate (LFP)
8.2.1.3. Lithium Nickel Cobalt Aluminum Oxide
8.2.1.4. Lithium Manganese Oxide
8.2.1.5. Lithium Titanate
8.2.1.6. Lithium Nickel Manganese Cobalt
8.2.2. Europe Lithium-Ion Battery Market by Capacity
8.2.2.1. Below 3,000 mAh
8.2.2.2. 3,001 mAh–10,000 mAh
8.2.2.3. 10,001 mAh–60,000 mAh
8.2.2.4. Above 60,000 mAh)
8.2.3. Europe Lithium-Ion Battery Market by Application
8.2.3.1. Automotive
8.2.3.2. Consumer Electronics
8.2.3.3. Industrial
8.2.3.4. Energy Storage Systems
8.2.3.5. Medical Devices
8.2.3.6. Others
8.2.4. UK Lithium-Ion Battery Market All-Up
8.2.5. Germany Lithium-Ion Battery Market All-Up
8.2.6. France Lithium-Ion Battery Market All-Up
8.2.7. Spain Lithium-Ion Battery Market All-Up
8.2.8. Rest of Europe Lithium-Ion Battery Market All-Up
8.3. Asia-Pacific Lithium-Ion Battery Market Revenue Forecast till 2032
(Option 3: As a part of the free 25% customization)
8.3.1. Asia-Pacific Lithium-Ion Battery Market by Product
8.3.1.1. Lithium Cobalt Oxide (LCO)
8.3.1.2. Lithium Iron Phosphate (LFP)
8.3.1.3. Lithium Nickel Cobalt Aluminum Oxide
8.3.1.4. Lithium Manganese Oxide
8.3.1.5. Lithium Titanate
8.3.1.6. Lithium Nickel Manganese Cobalt
8.3.2. Asia-Pacific Lithium-Ion Battery Market by Capacity
8.3.2.1. Below 3,000 mAh
8.3.2.2. 3,001 mAh–10,000 mAh
8.3.2.3. 10,001 mAh–60,000 mAh
8.3.2.4. Above 60,000 mAh)
8.3.3. Asia-Pacific Lithium-Ion Battery Market by Application
8.3.3.1. Automotive
8.3.3.2. Consumer Electronics
8.3.3.3. Industrial
8.3.3.4. Energy Storage Systems
8.3.3.5. Medical Devices
8.3.3.6. Others
8.3.4. China Lithium-Ion Battery Market All-Up
8.3.5. India Lithium-Ion Battery Market All-Up
8.3.6. Japan Lithium-Ion Battery Market All-Up
8.3.7. Rest of APAC Lithium-Ion Battery Market All-Up
8.4. RoW Lithium-Ion Battery Market Revenue Forecast till 2032
(Option 4: As a part of the free 25% customization)
8.4.1. RoW Lithium-Ion Battery Market by Product
8.4.1.1. Lithium Cobalt Oxide (LCO)
8.4.1.2. Lithium Iron Phosphate (LFP)
8.4.1.3. Lithium Nickel Cobalt Aluminum Oxide
8.4.1.4. Lithium Manganese Oxide
8.4.1.5. Lithium Titanate
8.4.1.6. Lithium Nickel Manganese Cobalt
8.4.2. RoW Lithium-Ion Battery Market by Capacity
8.4.2.1. Below 3,000 mAh
8.4.2.2. 3,001 mAh–10,000 mAh
8.4.2.3. 10,001 mAh–60,000 mAh
8.4.2.4. Above 60,000 mAh)
8.4.3. RoW Lithium-Ion Battery Market by Application
8.4.3.1. Automotive
8.4.3.2. Consumer Electronics
8.4.3.3. Industrial
8.4.3.4. Energy Storage Systems
8.4.3.5. Medical Devices
8.4.3.6. Others
8.4.4. Brazil Lithium-Ion Battery Market All-Up
8.4.5. South Africa Lithium-Ion Battery Market All-Up
8.4.6. Saudi Arabia Lithium-Ion Battery Market All-Up
8.4.7. UAE Lithium-Ion Battery Market All-Up
8.4.8. Rest of world (remaining countries of the LAMEA region) Lithium-Ion Battery Market All-Up
9. Competitive Landscape Analysis
9.1. Porter’s Five Forces Analysis
9.2. Industry – Competitive Landscape
9.3. Market Presence (Intensity Mapping)
9.4. Key Strategic Market Developments
10. Company Profiles (Option 5: Free 25% Customization - Profiles of 5 Additional Companies of your Choice)
10.1. LG Chem Ltd.
10.1.1. Company Overview
10.1.2. Key Executives
10.1.3. Footprint & Employee Strength
10.1.4. Product Offerings
10.1.5. Financials
10.1.6. Key Company Developments
10.2. Panasonic Corporation
10.2.1. Company Overview
10.2.2. Key Executives
10.2.3. Footprint & Employee Strength
10.2.4. Product Offerings
10.2.5. Financials
10.2.6. Key Company Developments
10.3. Hitachi Ltd.
10.3.1. Company Overview
10.3.2. Key Executives
10.3.3. Footprint & Employee Strength
10.3.4. Product Offerings
10.3.5. Financials
10.3.6. Key Company Developments
10.4. Johnson Controls
10.4.1. Company Overview
10.4.2. Key Executives
10.4.3. Footprint & Employee Strength
10.4.4. Product Offerings
10.4.5. Financials
10.4.6. Key Company Developments
10.5. Samsung SDI Co. Ltd.
10.5.1. Company Overview
10.5.2. Key Executives
10.5.3. Footprint & Employee Strength
10.5.4. Product Offerings
10.5.5. Financials
10.5.6. Key Company Developments
10.6. BAK Group
10.6.1. Company Overview
10.6.2. Key Executives
10.6.3. Footprint & Employee Strength
10.6.4. Product Offerings
10.6.5. Financials
10.6.6. Key Company Developments
10.7. BYD Company Ltd.
10.7.1. Company Overview
10.7.2. Key Executives
10.7.3. Footprint & Employee Strength
10.7.4. Product Offerings
10.7.5. Financials
10.7.6. Key Company Developments
10.8. GS Yuasa Corporation
10.8.1. Company Overview
10.8.2. Key Executives
10.8.3. Footprint & Employee Strength
10.8.4. Product Offerings
10.8.5. Financials
10.8.6. Key Company Developments
10.9. Toshiba Corporation
10.9.1. Company Overview
10.9.2. Key Executives
10.9.3. Footprint & Employee Strength
10.9.4. Product Offerings
10.9.5. Financials
10.9.6. Key Company Developments
10.10. Saft Group
10.10.1. Company Overview
10.10.2. Key Executives
10.10.3. Footprint & Employee Strength
10.10.4. Product Offerings
10.10.5. Financials
10.10.6. Key Company Developments
10.11. Valence Technology
10.11.1. Company Overview
10.11.2. Key Executives
10.11.3. Footprint & Employee Strength
10.11.4. Product Offerings
10.11.5. Financials
10.11.6. Key Company Developments
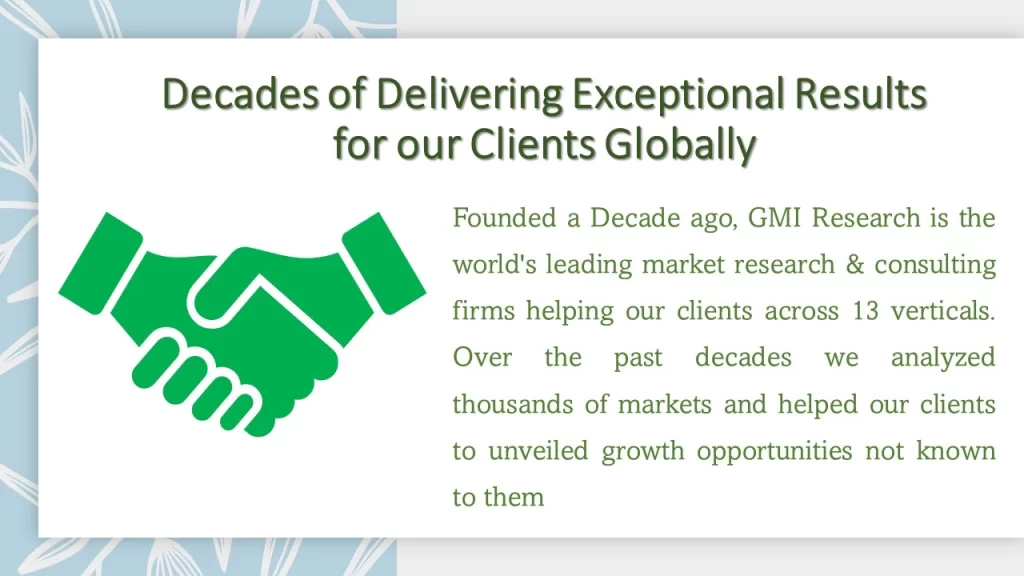
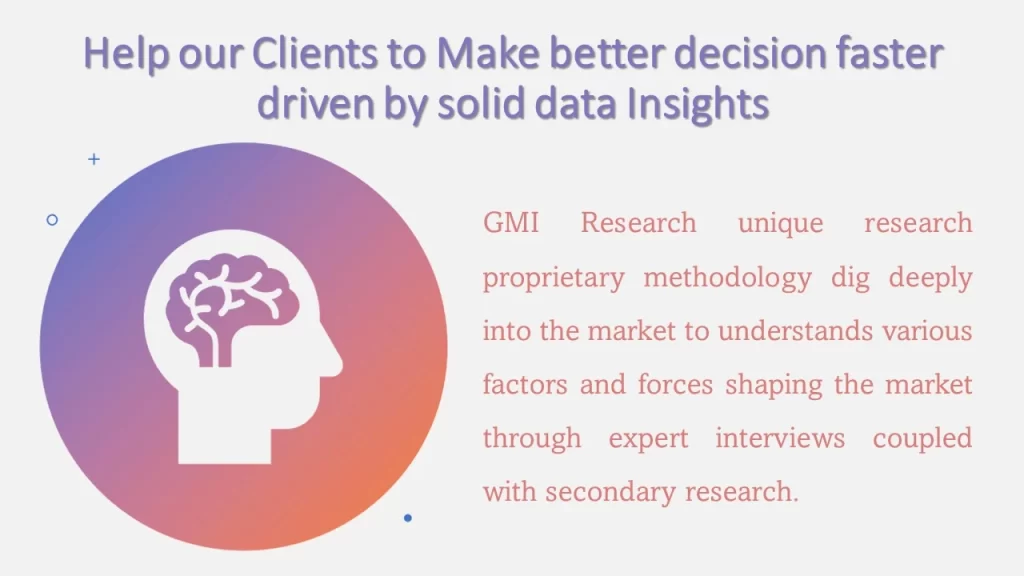
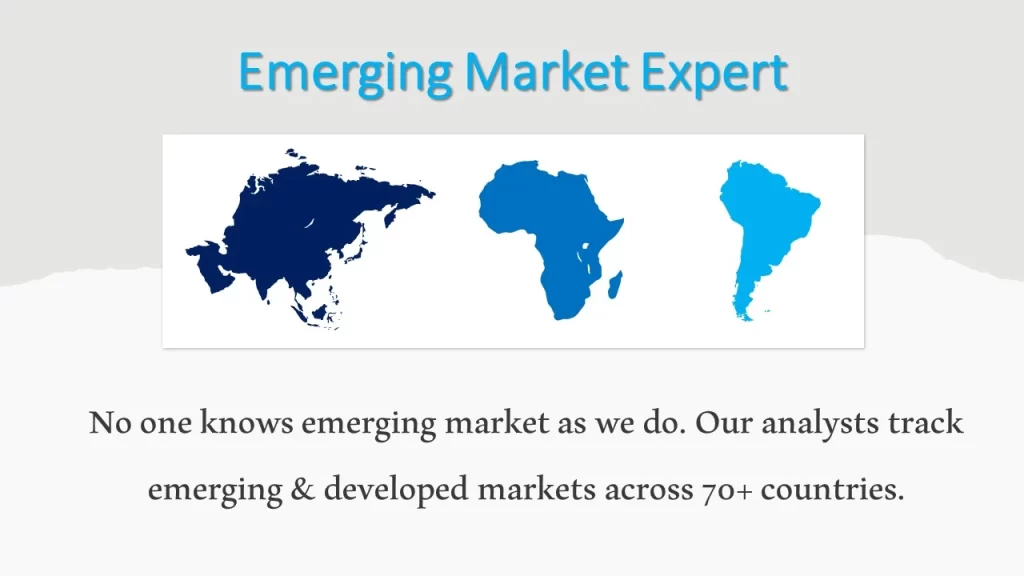
11. About GMI Research
*Details on Financials might not be available in case of unlisted/private companies.
*The list of companies is based on preliminary research in this report, the companies in the final report may change based on research findings.
- Published Date: Feb-2025
- Report Format: Excel/PPT
- Report Code: CFES01A-00-0719
Licensing Options
Single-User License:
The report is used by the purchaser (One Individual) only
Multi-User License:Report is shared with maximum 5 users (employees) including the purchaser of the purchasing corporation only
Corporate License:
Report is shared with unlimited user (employees) of the purchasing corporation only
The report is used by the purchaser (One Individual) only
Multi-User License:Report is shared with maximum 5 users (employees) including the purchaser of the purchasing corporation only
Corporate License:
Report is shared with unlimited user (employees) of the purchasing corporation only
Lithium-Ion Battery Market Share, Size, Statistics, Growth Opportunities & Industry Forecast Report, 2025-2032
$ 4,499.00 – $ 6,649.00
Why GMI Research